S&P 500 is with past data, as I don't have updated one. See how the longitudinal difference of 22.5 and 4 degrees gave trend reversal. This also works for Gold, Crude etc.
"This rule is one of the strangest I have been able to
find. It is very simple, although it entails work to project correctly. We use
the geocentric longitude of Sun at any important top or bottom. To this
longitude we add each time the value 126 Deg 30'. When the addition has been
made and the exact place located in the Zodiac; i.e. the degrees and minutes
and the right sign belonging to them, we look when Mercury is going to pass
this point. Hold fast that day! The movement that developed previously at the
Sun's place will come off in the same direction at the Mercury place. Thus,
Mercury imitates the Sun effect...."
This is what George Bayer said in his Rule No- 32.
So what we have to do is-
Adding 126.50 (decimal degrees equivalent to 126 deg. 30’) to the degrees of Sun. The degrees of Sun need to be taken from the day when the Stock/Index made an important Top or Bottom.
After addition, we will get some new value. Now, when Mercury passes this new value, the stock/market will move in the same direction, the one which Sun did previously, i.e. Mercury will imitate the Sun.
Sometimes, a small top or bottom has given a very good trend reversal
About the second
part, where George Bayer said that Mercury will imitate the Sun, but sometimes
reverse happened. Not often, but it did. Don’t know why?
Thus this Rule can be best used for Trend Reversal…
Sometimes a day after the date, trend got reversed.
Images:
Note: The Crude data has been taken from www.stooq.com
34 deg 36’ 30” (5 times of the
previous or 25 times of the first unit)
Which when converted to decimal degree gives –
1.15361
6.92167
34.60833
I will be using second and third unit only for explanation.
Now take any significant Low/High and get the geocentric
longitudes of Venus on that day. Add
above values to it. When Venus will cross/pass these, we get a trend reversal
aka trend change aka CIT.
On 14-Dec-2015 we got a low on Nifty, Venus was at 196.7069895.
So we add 6.92167 and 34.60833 to it. We got 2 new values, 203.6286595 and 231.3153195
respectively. Venus crossed these values on 20-Dec-2105 and 12-Jan-2016.
Sometimes we get trend reversal on exact date and sometimes
a day after, depending when Venus crosses/passes those degrees.
When retrograde,
we need to minus these values
from the longitude. Also the last unit value of 34.60833 will not be applicable
when Venus is in retrograde motion.
The avg. daily movement of Venus, when in regular direct
motion is greater than the first unit.
So, the first unit value of 1.15361 will work when Venus is in retrograde motion.
Note: The geocentric
longitudinal value is taken from ZET with my setting and is for 09:30 AM
Mumbai, India.
Right now, I am posting Nifty 50 charts. Later, will add
more stocks.
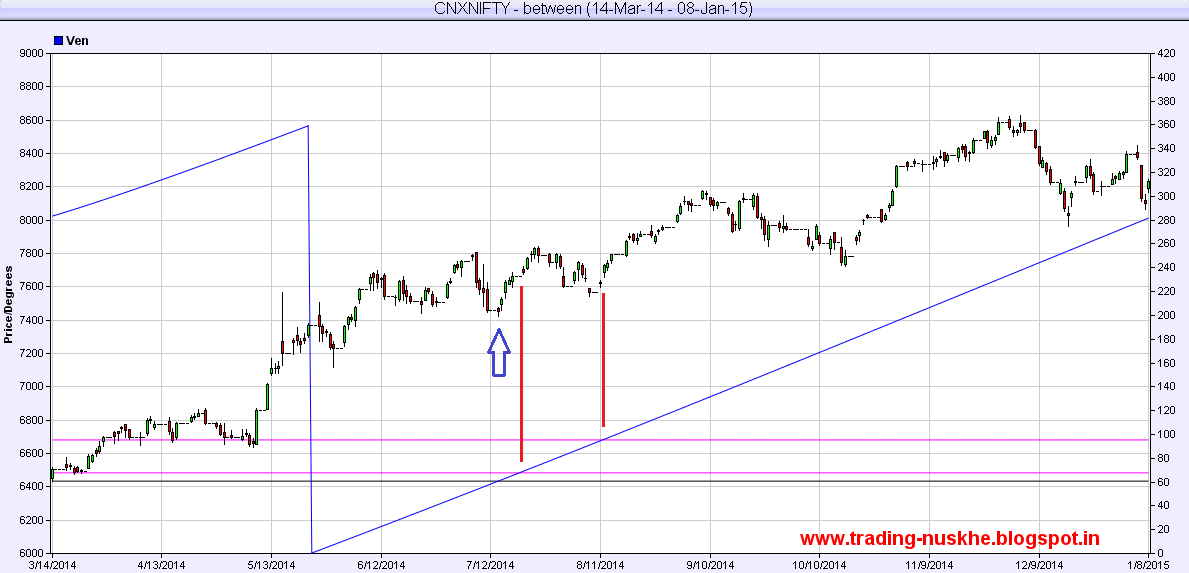
Following images are self explanatory. The horizontal green and gray lines are for dates when Nifty made a low/high. The magenta colored lines are for the projected trend reversal dates.
I hope all of you have understood the previous method of
using Heliocentric Latitude of Venus to
find the CITs (Turning Points or Turning Dates or Trend Reversal Dates). There
is another method, using the Heliocentric Latitude of Venus to find the same.
This method is from Stock
and Commodity Trader’s Hand-book of Trend Determination by George Bayer.
This is Rule No. 2A. (Page No.
will vary depending upon the version which you have. ;) )
“Measure from important tops or bottoms by using Venus in
heliocentric position. Project from such tops or bottoms the value of 4° 58'.
During certain periods I found that 4° 52' would be more advantageous, but
the difference is so small it is not important .....”
The decimal equivalent of 4° 58' is 4.96667 and that of 4° 52' is 4.86667. The difference between these 2 values is of 0.1. I have used 4.96667 for the demonstrations.
And the maximum latitude
value of Venus, southwards is -3.39492 and northwards is 3.39495.
Coming to steps…..
Take any significant (I have dropped the word "important") low or high. Note down the value heliocentric latitude.
If the value is negative,
then add 4.96667 to it. If the value
if positive, the substract it from 4.96667. If this value is lesser or greater then the max. value of -3.39492/3.39495, then add/substract the max. value respectively.
We got a positive answer. Now put a negation (minus) sign to
it. Now we have 2 values, answer value and answer value with negation sign. Check
when Venus crosses these latitude values, in future. Those dates will be CITs
or trend change dates or turning dates.
On 17-Oct-2014, Nifty made a low; the latitude of Venus was
2.90275. Being a positive value, we will substract it from 4.96667, which gives
2.06392. Another value will be -2.06392. Below image is self explanatory.
L1 and L2 lines are for 2.06392 and -2.06392
respectively. A, B, C, D, E, F (Red Vertical Lines)
are the days when Venus crossed the lines L1 and L2. G is the day coming on
02-Oct-2015, Friday, a holiday when Indian Market will be closed. So we should
consider the next trading session, which will be on 05-Oct-2015, Monday. (Sometimes
NSE trades on Saturday’s. If this happens then we will need to check it on 03-Oct-2015)
The Blue vertical lines are for the maximum latitude value,
both sides. These too are important for trend reversals.
The below image is of RELIANCE. Here I have shown how the
ZERO Line too, gives us trend reversal indicated by Magenta vertical lines. The
next ZERO Line crossing is on Sunday, 27-Oct-2015, so will take 28-Oct-2015. And the next L1 and L2
crossing, derived from the low of 14-Jan-2015 will be on 09-Oct-2015 and 13-Nov-2015.