Pages

Showing posts with label Nifty. Show all posts

Wednesday, December 3, 2025

LEARN HOW TO FIND NEXT DAY GAINERS USING ASTROLOGY


Hello friends, 


         “Time is the most important factor in forecasting market movements.”. - W.D. GANN 

        In the stock market, timing is everything.


        What if one knows today which stock is going to rise tomorrow, or day after tomorrow… or even a week later… or on a specific date?

If one gets such clarity, taking an early position becomes extremely easy — whether it is entering near a strong support level or taking advantage of a healthy retracement — and the profit potential becomes extraordinary.

        Most traders keep searching for tips, news, or chart patterns. But very few understand that planetary movements often trigger powerful price actions in specific stocks and sectors. Astrology may not replace technical analysis, but when used correctly, it can become a high-probability forecasting tool for identifying stocks before they make a move.

        Using around data of 15-20 yrs of certain stock, I have formulated certain simple principles. Using these simple principles, one can know which stock will meet the criteria and thus be a gainer on that particular date.


Sunday, January 19, 2025

New Options Trading System using Physics and Mathematical constants.

As the title suggests, this is my new system for options trading. I have used certain constants from physics and mathematical ratios for the calculations. I developed it quite a while ago but had not tested it thoroughly at that time. However, a few weeks ago, I tested it and found it to be astonishingly effective. I simply call it the "Buy Above Sell Below" system.

Every day, it will plot a lime-colored line labeled as "Buy Above (Buy Call)" and a red-colored line labeled as "Sell Below (Buy Put)." Based on these two lines, Stop Loss (aqua-colored small dotted line), lime-colored lines with labels "Up TP-1," "Up TP-2," "Up TP-3" up to TP-5 are plotted, which are various Take Profit levels. Similarly, Take Profit levels for the downside are plotted. A Bollinger Band is also present, with the Upper Band in red and the Lower Band in lime. The Middle Band changes color: it is red when prices are below it and lime when prices are above it.

A yellow-colored 5-period EMA is also present, along with a 20-period EMA in white. Enough of the description; now let's discuss Entry, Stop Loss levels, and where to Take Profit. Those who are observant might notice that the Stop Loss level and Take Profit levels are already shown.

I prefer this system for buying options, both stock and index. Below is an image for Nifty; others will be shared too.

Entry Criteria: When the price breaks the "Buy Above" (hereafter BA) line, we will consider taking a long entry. However, earlier, I used to enter on this signal and had accepted losses. Now, a refined entry criterion:

Both the price and the 5-period EMA need to cross the BA line. Sometimes, the price will cross, and after 1, 2, 3, or even more candles, the 5-period EMA will cross. So, we have to wait until the 5-period EMA crosses the BA level. Then, enter on the same candle (if price action allows) or on the open of the next candle.

I prefer ATM Strike Options.

Similarly, if the 5-period EMA crosses the "Sell Below" line (SB, hereafter), I prefer to buy ATM Put options.

Stop Loss: The Stop Loss is already mentioned in the image (it is hard-coded in the Pine Script code).

Take Profit: These levels are also mentioned. However, as per my personal experience, TP-1 on either side has the highest probability. Additionally, the Bollinger Bands help to select the Take Profit level for that particular day. Also, I would suggest profit trailing, which I do. I trail it till the prices closes below 5 period EMA. 

👉  NO  RE-PAINTING

👉 NO NEED TO ANALYSE WHERE THE INDEX OR STOCK WILL GO, NO IFS AND BUTS

THE BEST PART OF THIS SCIPT IS THAT IT CAN BE APPLIED DIRECTLY ON THE OPTIONS CHARTS...  the 2nd image is of NIFTY 23-Jan-2025 23300 strike Call. When  directly applied on Call or Put charts, the TP-1 level mostly comes exceeds 5%. More in coming posts....


Nifty Chart ðŸ‘‡


Nifty 23300 23-Jan-2025 expiry Call ðŸ‘‡

BankNifty Chart ðŸ‘‡
HDFCBANK Chart  ðŸ‘‡
APPL 👇
GOLD(XAUUSD) 15 MIN TF 👇


Share your TV id with me on aachiney@gmail.com with BASB in subject to get a 15 day demo.  


Friday, December 20, 2019

Using Chhaya Graha’s or Aprakasha Graha’s to determine Trend Reversal


Aprakasha Graha’s means Non-luminous planets. Upa Graha’s means secondary planets.

Chhaya means shadowy, those can’t be seen. They are just like Rahu (North Node) and Ketu (South Node), mathematical sensitive points.

These non-luminous planets can be sub-divided or grouped in 2 different ways:

Sun longitude based.
Time based or Sun rise and Sun set based.

Below, find the name of 5 non-luminous planets based on the longitude of Sun.

Dhooma/Dhuma, Vyatipata/Pata, Parivesha/Paridhi, Indrachapa/Kodanda/Chapa/, Upaketu/Dhwaja/Shikhi

Kaala, Mrityu, Arthaprahara, Yamaghantaka, Gulika and Maandi are time based.

Here, I am going to use the mathematical point Chhaya graha's. 

I will not go in much detail about them, only the mathematical calculation part will be brought forward. More information on these non-luminous planets can be found in Brihat Parashara Hora Shashtra. Please, don't forget... Google, too. ;)

These points are derived from the longitudes of the Sun.


Calculation Part:

“The position of Dhuma is ascertained by adding 4 signs, 13 deg and 20 mins to the longitude of the Sun. The position of Vyatipata will be found by subtracting the longitude of Dhuma from 12 signs. The position of Parivesha by adding 6 signs to that of Vyatipata. The position of Indrachapa is calculated by subtracting longitude of Parivesha from 12 signs. The position of Upaketu by adding 16 deg and 40 mins to that of Indrachapa.”


Dhuma: Sun Longitude + 133.33 deg (Decimal degrees)

Vyatipata:         360 – Longitude of Dhuma

Parivesha:         Vyatipata Longitude + 180

Indrachapa: 360 – Parivesha Longitude

Upaketu:         Indrachapa + 16.66

So if Sun longitude is 120 degrees (decimal) then, an example will clear the doubts

Dhuma:         120 + 133.33 = 253.33

Vyatipata: 360 – 253.33 = 106.67

Parivesha:         106.67 + 180 = 286.67

Indrachapa: 360 - 286.67 = 73.33

Upaketu:         73.33 + 16.67 = 90

When degrees will go above 360, then subtract 360 from it. From above, it can be seen that Dhuma and Indrachapa are always opposite to each other. Because, 253.33 – 73.33 = 180. 

Similarly, Vyatipata and Parivesha are opposite to each other. 

So, considering either Dhuma or Indrachapa will do the needful. Similarly, either Vyatipata or Parivesha will do the needful. 


The below image will help you to understand how the longitudes will be seen. The longitudes of all the points and Sun are Sidereal, by default. 

Sun & Dhuma (Sidereal Longs.)

Below is the image with Vyatipata and Dhuma.

Vyatipata & Dhuma


Now, we will see what happens when this Sun point based Upa-graha's ingress in 12 signs. The horizontal lines are the longitudinal lines of ingress. In all the images below, I have used Dhuma, only. Some may think why Dhuma only. The reason is simple..... KISS. 


There are various simple and non-orthodox techniques which can be used to determine the trend reversal using these Non-luminous planets. I have shared the first and simple one.


Friday, November 22, 2019

Ingress of Planets in various Nakshatras or Lunar Mansions


The Zodiac is divided into 12 equal parts and each division is called Rasi or Sign or Solar Mansion. These are Aries (Mesha), Taurus (Vrishabha) so on till and Pisces (Meena) and each measuring 30 degrees.


The Hindu or Vedic astrology has another division. In this division, the Zodiac is divided into 27 equal parts each measuring 13-20 degrees or 13 degrees and 20 minutes. (The equivalent decimal degrees will be 13.333.)


These 27 divisions are called as Lunar Mansions or Nakshatras or Asterisms or Star Constellations. 


These 27 Lunar Mansions are named as – Ashwini, Bharani, Krittika, Rohini, Mrigashira, Ardra, Punarvasu, Pushya, Ashlesha, Magha, Poorva Phalguni, Uttara Phalguni, Hasta, Chitra, Swati, Vishakha, Anuradha, Jyeshtha, Moola, Poorva Ashadha, Uttara Ashadha, Shravana, Dhanistha, Satabhisha, Poorva Bhadrapada, Uttara Bhadrapada and Revati.


So from 0 to 13.333 (decimal degrees, otherwise would be 13 Deg. and 20 Minutes), it is Ashwini. From 13.333 to 26.667 it is Bharani and so on.


Each Nakshatra is again divided into 4 equal parts of 3 deg. and 20 minutes (decimal equivalent will be 3.333). Each part is called as Pada or Quarter. In another post, this topic will be discussed, later, with the help of proper images.


9 planets have been given the lordship of these 27 Nakshatras. In other words, we can say that the 9 planets have influence on these 27 Nakshatras. The order of lordship is as follows-

Ketu (South Node), Venus, Sun, Moon, Mars, Rahu (North Node), Jupiter, Saturn and Mercury.


So the first 9 Nakshatras will be ruled by the 9 planets, in the order mentioned above. Then from 10 to 18 Nakshatras, again the lordship will be in the same order. And from 19 to 27 Nakshatras, again the lordship will be in the same order.


So the 1, 10 and 19 Nakshatra will be ruled by Ketu (South Node). In other words, Ashwini, Magha and Moola are influenced by Ketu. 2, 11, 20 (i.e. Bharani, Poorva Phalguni and Poorva Ashadha) will be ruled by Venus. And so on.


Now the Solar Mansion, Aries which measures 30 degrees contains Ashwini (13.333), Bharani (13.333) and one-fourth of Krittika (3.333 or 1st Pada or 1st Quarter). The remaining 3/4th of Krittika will be in the Solar Mansion Taurus. So the Taurus will have Krittika (10 deg or 2nd, 3rd and 4th Padas or Quarters), Rohini (13.333 deg i.e. complete) and half of Mrigashira (6.667 deg or 1st and 2nd Padas or Quarters). In this way the Lunar Mansions are allotted to Solar Mansions.


The 1/3rd of the Zodiac i.e.; 120 degrees (first 4 signs; Aries, Taurus, Gemini and Cancer) are allotted first 9 Lunar Mansions. Leo, Virgo, Libra and Scorpio will get next 9 Lunar Mansions. And from Sagittarius to Pisces will get last 9 Nakshatras.


These Lunar Mansions or Constellations are either a group of stars or a single star. More information can be found here - https://en.wikipedia.org/wiki/Nakshatra


 As I always say, A Picutre Is Worth Thousand Words... Right... ?


BTW, here after I will be using a common term for these Lunar Mansions, Asterism or Constellations and it will be Nakshatra.


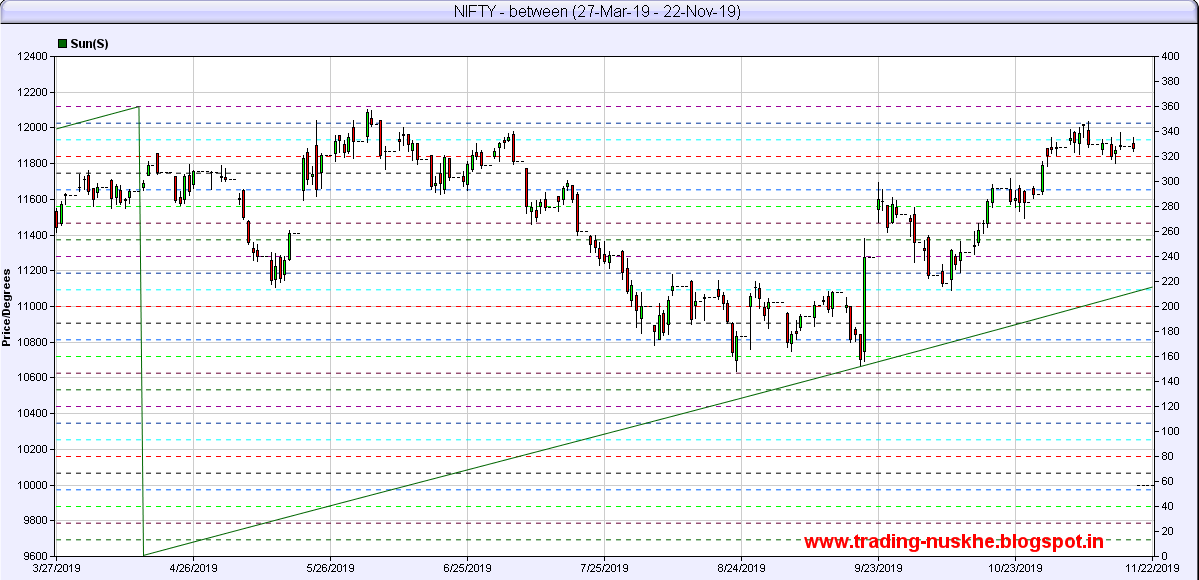
In the above image, you will see that, there are dashed horizontal lines denoting the starting degrees (Ingress Point) each Nakshatra. Also you will see 3 dashed lines are identical in color, denoting the lord ship of a particular planet. Exception is the 0 (zero) deg line.


Below image is of NIFTY with Sun Ingress in these 27 Nakshatras.


Below image is of NIFTY with Mercury Ingress...


Below image is of NIFTY with Mars and Jupiter Ingress...


Below image is of Crude (MCX) with Mars Ingress...


Below images are of Crude (MCX) with Saturn and Rahu (North Node) Ingress...


To be contd...


  Note: The longitudinal degrees are Sidereal (Niryana).

Sunday, August 18, 2019

Combustion of Mars - Sep-2019


On 02-Sep-2019, Mars will conjunct Sun at 04:12 pm, IST. The time may differ as per the software settings.


Sunday, May 5, 2019

Combustion of Mercury May-Jun 2019


For new-comers, read this article first.


Image below is itself sufficient to know the important trend reversal dates.


Thursday, April 25, 2019

An EXTENSION to George Bayer's Rule No- 44 (Mercury Halfway Retrograde)


You might be surprised with the word “EXTENSION” that appeared in the title…..

What the word “EXTENSION” means…..

I will explain it, but first try to understand what Mr. George Bayer stated in his Rule No- 44.


In his book, “Stock and Commodity Traders´ Hand-Book of Trend Determination”, stated …


MERCURY HALFWAY RETROGRADE

The rule here concerns only the retrograde movement and centers specifically on the halfway point from the moment Mercury turns retrograde to the place where it moves again direct. We figure the difference of these two places in the Zodiac, divide by two and look in the ephemeris (Raphael’s) for the date when this halfway point is reached….


Now, coming to “EXTENSION” ….. This is in 2 parts.


PART - 1

NOT ONLY…. MERCURY does this, but other planets also give the same effect…..


Below are the images of NIFTY (Indian Index) with Jupiter and Venus halfway Retrograde event.


NIFTY Jupiter Halfway Retrograde

NIFTY Venus Halfway Retrograde

PART – 2


NOT ONLY….. HALFWAY does, but HALF of Halfway also works!!!!!


Below are the images of NIFTY (Indian Index) with Jupiter and Venus halfway Retrograde event.


NIFTY Jupiter HALF of Halfway Retrograde

NIFTY Venus HALF of Halfway Retrograde


Some more.....

CRUDE-INT Mars HALF of Halfway Retrograde

CRUDE-INT Venus HALF of Halfway Retrograde

USDJPY Venus HALF of Halfway Retrograde


Note:
1. CRUDE-INT means Crude Futures
2. USDJPY, the currency pair
3. End of the day data for both Crude Futures and USDJPY taken from www.stooq.com
4. Ephmeris data taken at 9:15 am, Place: My Residence. ;)


Friday, January 6, 2017

Longitudinal difference between Sun, Mercury and Venus with 22.5 and 45 degrees difference

NIFTY 50

RELIANCE

S&P 500


S&P 500 is with past data, as I don't have updated one. See how the longitudinal difference of 22.5 and 4 degrees gave trend reversal. This also works for Gold, Crude etc.


Monday, November 14, 2016

Apogee and Perigee of Moon and Super (Duper) Moon


The Moon’s distance from Earth varies due to its elliptical orbit around the Earth. So, when the Moon can be at closest of farthest point from Earth.

Apogee is the farthest point from the Earth whereas Perigee is the closest point from the Earth. When at Perigee, the closest point, Moon appears larger than normal.

Supermoon is the coincidence of a Full Moon (or New Moon or Poornima) and also the Moon is at Perigee. The technical term is Perigee-syzygy of the Earth-Moon-Sun system. The opposite of Supermoon is Micromoon.

Most of us have studied or heard that Moon have an effect of tides due to its gravitational pull. So the Perigee and Apogee phenomena will have an effect on the tides on Earth.

Does this Apogee and Perigee phenomena effects Stock Markets?

Yes.

This effect has been proved by many, both pictorially and statistically. So, why am I doing it again?

To know the reason, go through all the images.

BTW, I too, will be watching this astronomical phenomenon. J

Below are the self explanatory images.

The first image shows the distance of Moon from Earth with Apogee and Perigee. 


Many people (traders) thus use Moon’s distance from Earth to determine the trend reversal. The Apogee and Perigee points or date with +/- 1 day has shown trend reversal. See below image. I have used NIFTY50 Index for the same.


Now coming to another point, this too can be used as a probable trend reversal point.
Note the distance of Moon at Perigee/Apogee and also at Apogee/Perigee. Find the mid-point of this. Now, when Moon is that much farthest from Earth, we get a trend reversal. This need to be calculated for each cycle.

Example:

On April 30, 2015, Moon was at a distance of 405085 km from Earth. This was the Apogee Point. On May 16, 2015, Moon was at Perigee with a distance of 366084.67 km. The Mid-Point will 385584.85 km. Moon crossed this distance somewhere around May 7, 2015. And we got a low on this date!!!

The Mid-Point value can be obtained by doing simple mathematics. Find the difference of two extreme values and either subtract it from the highest value of add to the lowest value. :)

See the below image to have a clear idea.


Most of the time, the Mid-Point has given trend reversal.