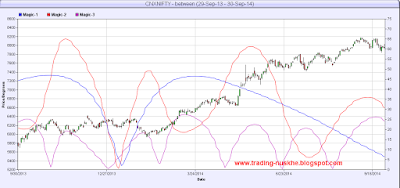
I am not going to tell much detail about Sun, Mercury and Venus. The only thing that I will is that they are always near the Sun. They are never seen as square or opposition to Sun in Geocentric system.
Mercury stays between 28° from Sun. Similarly, Venus stays between 45° from Sun. Both, never goes beyond this limit.
This astrological phenomenon gives us 3 distinct systems to determine the trend reversal in Stock Market. These 3 systems are formed between the Sun, Mercury and Venus. We have to use them in pairs. And these pairs are;
- Sun and Mercury (6 - 7 times a year)
- Sun and Venus (3 - 4 times a year)
- Mercury and Venus (1 - 2 times a year)
These pairs are listed in the order of occurrence, the most occurring as first.
These pair lines are generated using the longitudes of respective planets.
I have used NIFTY for the demonstration purpose and below are the images which are self descriptive, so no need to explain. The RED vertical lines drawn indicate the trend reversal. View the images and come to a conclusion.
The first 4 images are for the pair of Sun and Mercury.


No comments:
Post a Comment