Showing posts with label Mercury. Show all posts
Showing posts with label Mercury. Show all posts
Sunday, September 29, 2019


Wednesday, July 31, 2019

Sunday, June 30, 2019

Monday, May 20, 2019

Sunday, May 5, 2019
Combustion of Mercury May-Jun 2019
For new-comers, read this article first.
Image below is itself sufficient to know the important trend reversal dates.

Thursday, April 25, 2019
An EXTENSION to George Bayer's Rule No- 44 (Mercury Halfway Retrograde)
You might be surprised with the word “EXTENSION” that
appeared in the title…..
What the word “EXTENSION” means…..
I will explain it, but first try to understand what Mr.
George Bayer stated in his Rule No- 44.
In his book, “Stock and Commodity Traders´ Hand-Book of
Trend Determination”, stated …
MERCURY
HALFWAY RETROGRADE
The rule here concerns only the retrograde movement and centers
specifically on the halfway point from the moment Mercury turns retrograde to
the place where it moves again direct. We figure the difference of these two
places in the Zodiac, divide by two and look in the ephemeris (Raphael’s) for
the date when this halfway point is reached….
Now, coming to “EXTENSION” ….. This is in 2 parts.
PART - 1
NOT ONLY…. MERCURY does
this, but other planets also give the same effect…..
Below are the images of NIFTY (Indian Index) with Jupiter and
Venus halfway Retrograde event.
 |
| NIFTY Jupiter Halfway Retrograde |
 |
| NIFTY Venus Halfway Retrograde |
PART – 2
NOT ONLY…..
HALFWAY does, but HALF of Halfway also works!!!!!
Below are the images of NIFTY (Indian Index) with Jupiter and
Venus halfway Retrograde event.
 |
| NIFTY Jupiter HALF of Halfway Retrograde |
 |
| NIFTY Venus HALF of Halfway Retrograde |
Some more.....
 |
| CRUDE-INT Mars HALF of Halfway Retrograde |
 |
| CRUDE-INT Venus HALF of Halfway Retrograde |
 |
| USDJPY Venus HALF of Halfway Retrograde |
Note:
1. CRUDE-INT means Crude Futures
2. USDJPY, the currency pair
3. End of the day data for both Crude Futures and USDJPY taken from www.stooq.com
4. Ephmeris data taken at 9:15 am, Place: My Residence. ;)
Monday, February 13, 2017


Friday, January 6, 2017
Longitudinal difference between Sun, Mercury and Venus with 22.5 and 45 degrees difference
 |
| NIFTY 50 |
 |
| RELIANCE |
 |
| S&P 500 |
S&P 500 is with past data, as I don't have updated one. See how the longitudinal difference of 22.5 and 4 degrees gave trend reversal. This also works for Gold, Crude etc.
Tuesday, November 22, 2016
Important Dates for NIFTY using Combustion and Conjunction of Mercury & Sun-2

As per my astrology software, JHora 8.0, for Mumbai, the actual Date/Time of Conjunction is 29-Dec-2016 at 00:17.
The dates and respective information is given below:
A - 28-Nov-2016 - Mercury starts combustion
B - 01-Feb-2017 - Mercury ends combustion
C - 14-Dec-2016 - Sun at starting degrees of Combustion
D - 11-Jan-2017 - Sun at end degrees of Combustion
E - 29-Dec-2016 - Conjunction Date
F - 20-Dec-2016 - Mercury Retrograde ** After Indian Stock Market closes
G - 08-Jan-2017 - Mercury Direct ** Time is around 15:12, when we are closing
H - 08-Dec-2016 - Mercury at Conjunction degrees, before going Retrograde
I - 20-Jan-2017 - Mercury at Conjunction degrees, after going Direct
J - 22-Dec-2016 - Sun at Orb of 6.66 deg. before Conjunction
K - 04-Jan-2017 - Sun at Orb of 6.66 deg. after Conjunction
L - 25-Dec-2016 - Sun at Orb of 3.33 deg. before Conjunction
M - 31-Dec-2016 - Sun at Orb of 3.33 deg. after Conjunction
Note: For point F and G, one may also consider the next trading session date.
Thursday, October 20, 2016

Friday, September 30, 2016
Logitudinal Difference between SUN, MERCURY and VENUS - 3
To know more, read the article.
Longitudinal difference between 2 planets is the distance between them in term of longitudinal degrees. The common term for this is Elongation, which can be Eastward and Westward.
You can take Google's help to know it better. :)

Tuesday, February 23, 2016


Monday, February 15, 2016
Mercury's Geocentric Longitude 126.50 After The Sun OR George Bayer's Rule No-32
"This rule is one of the strangest I have been able to
find. It is very simple, although it entails work to project correctly. We use
the geocentric longitude of Sun at any important top or bottom. To this
longitude we add each time the value 126 Deg 30'. When the addition has been
made and the exact place located in the Zodiac; i.e. the degrees and minutes
and the right sign belonging to them, we look when Mercury is going to pass
this point. Hold fast that day! The movement that developed previously at the
Sun's place will come off in the same direction at the Mercury place. Thus,
Mercury imitates the Sun effect...."
This is what George Bayer said in his Rule No- 32.
- Adding 126.50 (decimal degrees equivalent to 126 deg. 30’) to the degrees of Sun. The degrees of Sun need to be taken from the day when the Stock/Index made an important Top or Bottom.
- After addition, we will get some new value. Now, when Mercury passes this new value, the stock/market will move in the same direction, the one which Sun did previously, i.e. Mercury will imitate the Sun.
Sometimes, a small top or bottom has given a very good trend reversal
About the second
part, where George Bayer said that Mercury will imitate the Sun, but sometimes
reverse happened. Not often, but it did. Don’t know why?
Thus this Rule can be best used for Trend Reversal…
Sometimes a day after the date, trend got reversed.
Images:


Note: The Crude data has been taken from www.stooq.com
Wednesday, September 30, 2015
Longitudinal Difference between SUN, MERCURY and VENUS
I am not going to tell much detail about Sun, Mercury and Venus. The only thing that I will is that they are always near the Sun. They are never seen as square or opposition to Sun in Geocentric system.
Mercury stays between 28° from Sun. Similarly, Venus stays between 45° from Sun. Both, never goes beyond this limit.
This astrological phenomenon gives us 3 distinct systems to determine the trend reversal in Stock Market. These 3 systems are formed between the Sun, Mercury and Venus. We have to use them in pairs. And these pairs are;
- Sun and Mercury (6 - 7 times a year)
- Sun and Venus (3 - 4 times a year)
- Mercury and Venus (1 - 2 times a year)
These pairs are listed in the order of occurrence, the most occurring as first.
These pair lines are generated using the longitudes of respective planets.
I have used NIFTY for the demonstration purpose and below are the images which are self descriptive, so no need to explain. The RED vertical lines drawn indicate the trend reversal. View the images and come to a conclusion.
The first 4 images are for the pair of Sun and Mercury.


The next 4 are for the pair of Sun and Venus.


The next 4 are for Mercury and Venus.


The next 4 are for all the 3 pairs.

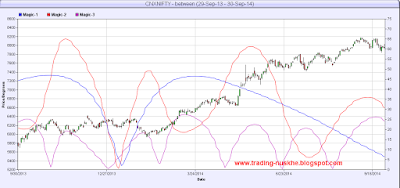


I am adding some images of S&P500 with Sun-Mercury Pair


Subscribe to:
Posts (Atom)