Pages

Showing posts with label Nifty 50. Show all posts

Sunday, January 19, 2025

New Options Trading System using Physics and Mathematical constants.

As the title suggests, this is my new system for options trading. I have used certain constants from physics and mathematical ratios for the calculations. I developed it quite a while ago but had not tested it thoroughly at that time. However, a few weeks ago, I tested it and found it to be astonishingly effective. I simply call it the "Buy Above Sell Below" system.

Every day, it will plot a lime-colored line labeled as "Buy Above (Buy Call)" and a red-colored line labeled as "Sell Below (Buy Put)." Based on these two lines, Stop Loss (aqua-colored small dotted line), lime-colored lines with labels "Up TP-1," "Up TP-2," "Up TP-3" up to TP-5 are plotted, which are various Take Profit levels. Similarly, Take Profit levels for the downside are plotted. A Bollinger Band is also present, with the Upper Band in red and the Lower Band in lime. The Middle Band changes color: it is red when prices are below it and lime when prices are above it.

A yellow-colored 5-period EMA is also present, along with a 20-period EMA in white. Enough of the description; now let's discuss Entry, Stop Loss levels, and where to Take Profit. Those who are observant might notice that the Stop Loss level and Take Profit levels are already shown.

I prefer this system for buying options, both stock and index. Below is an image for Nifty; others will be shared too.

Entry Criteria: When the price breaks the "Buy Above" (hereafter BA) line, we will consider taking a long entry. However, earlier, I used to enter on this signal and had accepted losses. Now, a refined entry criterion:

Both the price and the 5-period EMA need to cross the BA line. Sometimes, the price will cross, and after 1, 2, 3, or even more candles, the 5-period EMA will cross. So, we have to wait until the 5-period EMA crosses the BA level. Then, enter on the same candle (if price action allows) or on the open of the next candle.

I prefer ATM Strike Options.

Similarly, if the 5-period EMA crosses the "Sell Below" line (SB, hereafter), I prefer to buy ATM Put options.

Stop Loss: The Stop Loss is already mentioned in the image (it is hard-coded in the Pine Script code).

Take Profit: These levels are also mentioned. However, as per my personal experience, TP-1 on either side has the highest probability. Additionally, the Bollinger Bands help to select the Take Profit level for that particular day. Also, I would suggest profit trailing, which I do. I trail it till the prices closes below 5 period EMA. 

👉  NO  RE-PAINTING

👉 NO NEED TO ANALYSE WHERE THE INDEX OR STOCK WILL GO, NO IFS AND BUTS

THE BEST PART OF THIS SCIPT IS THAT IT CAN BE APPLIED DIRECTLY ON THE OPTIONS CHARTS...  the 2nd image is of NIFTY 23-Jan-2025 23300 strike Call. When  directly applied on Call or Put charts, the TP-1 level mostly comes exceeds 5%. More in coming posts....


Nifty Chart ðŸ‘‡


Nifty 23300 23-Jan-2025 expiry Call ðŸ‘‡

BankNifty Chart ðŸ‘‡
HDFCBANK Chart  ðŸ‘‡
APPL 👇
GOLD(XAUUSD) 15 MIN TF 👇


Share your TV id with me on aachiney@gmail.com with BASB in subject to get a 15 day demo.  


Friday, January 6, 2017

Longitudinal difference between Sun, Mercury and Venus with 22.5 and 45 degrees difference

NIFTY 50

RELIANCE

S&P 500


S&P 500 is with past data, as I don't have updated one. See how the longitudinal difference of 22.5 and 4 degrees gave trend reversal. This also works for Gold, Crude etc.


Tuesday, November 22, 2016

Important Dates for NIFTY using Combustion and Conjunction of Mercury & Sun-2


As per my astrology software, JHora 8.0, for Mumbai, the actual Date/Time of Conjunction is 29-Dec-2016 at 00:17.


The dates and respective information is given below:

A - 28-Nov-2016 - Mercury starts combustion
B - 01-Feb-2017 - Mercury ends combustion

C - 14-Dec-2016 - Sun at starting degrees of Combustion
D - 11-Jan-2017 - Sun at end degrees of Combustion

E - 29-Dec-2016 - Conjunction Date

F - 20-Dec-2016 - Mercury Retrograde  ** After Indian Stock Market closes
G - 08-Jan-2017 - Mercury Direct           ** Time is around 15:12, when we are closing

H - 08-Dec-2016 - Mercury at Conjunction degrees, before going Retrograde
I - 20-Jan-2017 - Mercury at Conjunction degrees, after going Direct

J - 22-Dec-2016 - Sun at Orb of 6.66 deg. before Conjunction
K - 04-Jan-2017 - Sun at Orb of 6.66 deg. after Conjunction

L - 25-Dec-2016 - Sun at Orb of 3.33 deg. before Conjunction
M - 31-Dec-2016 - Sun at Orb of 3.33 deg. after Conjunction


Note: For point F and G, one may also consider the next trading session date.


Thursday, September 15, 2016

Combustion of Jupiter


This article should have been posted a couple of weeks ago, so that we should have known the important dates quite before. Well… it’s always better to be late than never. :)
 
Coming to the point…..

 Jupiter is now in the state of combustion, which started on 03-Aug-2016 and will be up to 18-Nov-2016. As Jupiter is a slow moving planet, I have considered Orb of Influence of 3.33 and 6.66 degrees.

 
Using NIFTY 50, an Indian Index, I have tried to explain you this event.

Image 1


Image 2


Image 3


Below is an example of BANK NIFTY and GOLD. The color code of all vertical lines is the same as used in the previous images.


BANK NIFTY


GOLD


It can be seen that, Jupiter at starting and ending degrees of Combustion, at the Orb of 3.33 and 6.66, before and after the conjunction gives a trend reversal.

Similarly, Sun, when at the degrees of starting and ending of combustion also gives a reversal in trend. Same effect can be seen when Sun is at the Orb of 6.66 degrees before and after the conjunction.


Wednesday, September 14, 2016

Important Dates for NIFTY Using Combustion of Mercury


Here is the complete idea to understand this post.


Horizontal bold line is the actual line of combustion degrees. Dotted line is for the Orb which is of 6.66 Degs.


13-Sep : Sun - Mercury Conjunction.
20-Sep : Sun at the Orb, after Combustion.
23-Sep : Mercury turns Direct.
27-Sep : Sun at the Combustion Degrees, when Mercury will come out of Combustion.
01-Oct : Mercury at the degrees of Conjunction.
10-Oct : Mercury moving out of Combustion.


Tuesday, February 23, 2016

Longitudinal Difference between SUN, MERCURY and VENUS - 2


To know more, read the article.

NIFTY 50


SP500


Wednesday, February 10, 2016

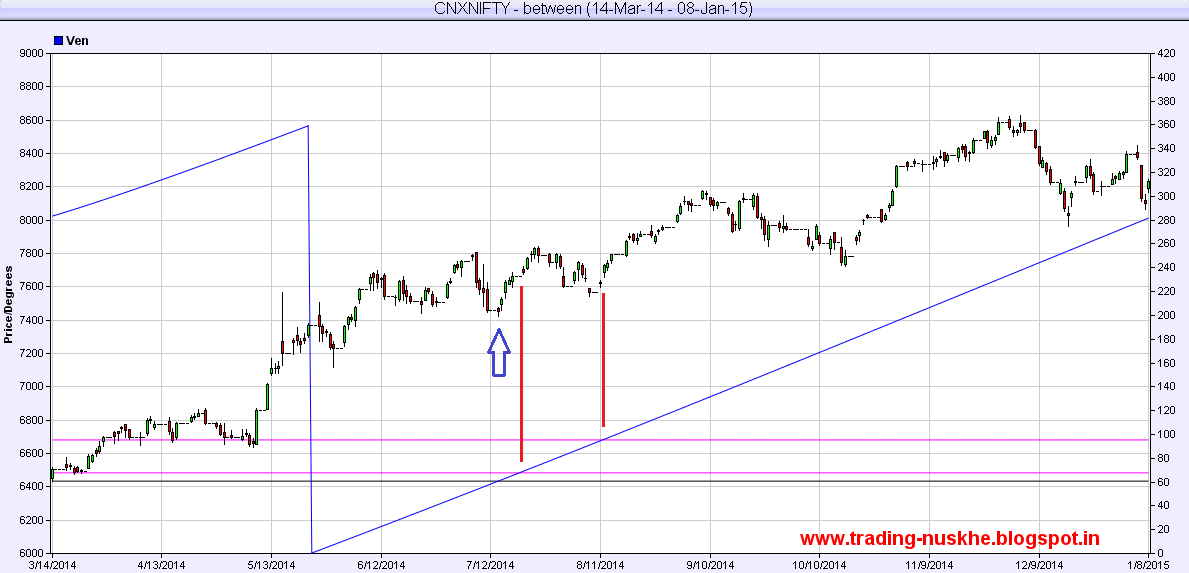
George Bayer’s Rule No – 14 OR VENUS Movement in Geocentric Longitude using a unit of 6.92167 and 34.6083


In Rule No. 14, George Bayer gave 3 units – 

1 deg 9’ 13’’ 

6 deg 55’ 18” (5 times of the previous unit)

34 deg 36’ 30” (5 times of the previous or 25 times of the first unit)


Which when converted to decimal degree gives –

                1.15361

                6.92167

                34.60833

I will be using second and third unit only for explanation.


Now take any significant Low/High and get the geocentric longitudes of Venus on that day. Add above values to it. When Venus will cross/pass these, we get a trend reversal aka trend change aka CIT.

On 14-Dec-2015 we got a low on Nifty, Venus was at 196.7069895. So we add 6.92167 and 34.60833 to it. We got 2 new values, 203.6286595 and 231.3153195 respectively. Venus crossed these values on 20-Dec-2105 and 12-Jan-2016.

Sometimes we get trend reversal on exact date and sometimes a day after, depending when Venus crosses/passes those degrees.

When retrograde, we need to minus these values from the longitude. Also the last unit value of 34.60833 will not be applicable when Venus is in retrograde motion.

The avg. daily movement of Venus, when in regular direct motion is greater than the first unit. So, the first unit value of 1.15361 will work when Venus is in retrograde motion.

Note: The geocentric longitudinal value is taken from ZET with my setting and is for 09:30 AM Mumbai, India.

Right now, I am posting Nifty 50 charts. Later, will add more stocks.

Following images are self explanatory. The horizontal green and gray lines are for dates when Nifty made a low/high. The magenta colored lines are for the projected trend reversal dates.


Monday, February 8, 2016

Using Combustion of Planets for Trend Reversal


Somewhere, I came across a line in a Financial Astrology book or website, that trader should note the dates when Mercury combusts. As far as I know, very little information is available on this phenomenon, I mean with respect to trading.  So I thought let’s check this phenomenon and found some astonishing results, which I am sharing with you. This article will be of help to those who love to use astrology for trading. The combustion phenomenon can be used to find the trend reversal aka trend change time.

Now, what this Combustion means?

Combustion is a phenomenon which occurs when a planet comes very close to the Sun and loses its luster and shine due to this closeness and thus the planet is said to be combust. This phenomenon is called as Combustion.

So, combustion will occur when the planet conjuncts Sun.

As per Vedic Astrology, while in the state of combustion, the planets lack its strength. The degrees when the planets get combusted are mentioned below-

Moon                   12 Degrees
Mercury               14 Degrees (when retrograde 12 Degrees)
Venus                  10 Degrees (when retrograde 8 Degrees)
Mars                    17 Degrees
Jupiter                  11 Degrees
Saturn                  15 Degrees

These are to be considered both sides.

For ex: Mercury (at 100 degrees) conjuncts Sun, then Mercury will be in the state of combustion from 100-14=86 degrees to 114 degrees.

As we all know that, for a trader, the conjunction of Mercury and Sun are best and quite frequent (around 6-7 per calendar year). Another advantage with Mercury is that being a fast mover (when retrograde speed varies) all the phenomenon occurs fast.

If we see the combustion of Saturn and Sun, to come out of the combustion state, which is almost 30 degrees (equal to sign degrees), Saturn will take long, rather very long period. So all of you will now understand that the time taken to come out of this state will depend upon the speed and direction of motion (Direct or Retrograde) of the planet. Saturn, Jupiter, Mars, Venus, Mercury and then Moon… Got It…

I think it’s enough text on combustion. A picture is worth thousand words…

Those more interested on this phenomenon can Google it.

Now... Will this combustion help us in trading?

Yes. It will…

Then, How…?

See the self explanatory images below:


Even the Sun gives Trend Reversal, when it comes on the combustion starting and ending degrees!!!

All orange colored vertical lines denotes Sun at the combustion degrees.


Note: The geocentric longitudinal degrees used for this study are for 9:30 AM, Mumbai. This article considers only Combustion Phenomenon and NO other astrological relationships between the planets.