Pages

Showing posts with label DLF. Show all posts

Wednesday, February 10, 2016

George Bayer’s Rule No – 14 OR VENUS Movement in Geocentric Longitude using a unit of 6.92167 and 34.6083


In Rule No. 14, George Bayer gave 3 units – 

1 deg 9’ 13’’ 

6 deg 55’ 18” (5 times of the previous unit)

34 deg 36’ 30” (5 times of the previous or 25 times of the first unit)


Which when converted to decimal degree gives –

                1.15361

                6.92167

                34.60833

I will be using second and third unit only for explanation.


Now take any significant Low/High and get the geocentric longitudes of Venus on that day. Add above values to it. When Venus will cross/pass these, we get a trend reversal aka trend change aka CIT.

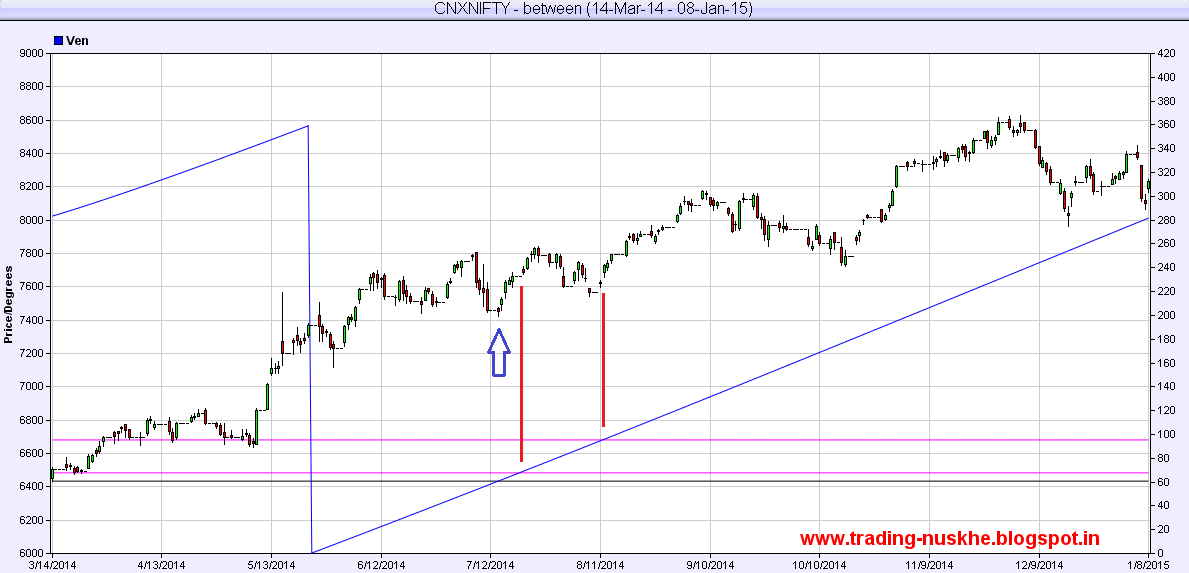
On 14-Dec-2015 we got a low on Nifty, Venus was at 196.7069895. So we add 6.92167 and 34.60833 to it. We got 2 new values, 203.6286595 and 231.3153195 respectively. Venus crossed these values on 20-Dec-2105 and 12-Jan-2016.

Sometimes we get trend reversal on exact date and sometimes a day after, depending when Venus crosses/passes those degrees.

When retrograde, we need to minus these values from the longitude. Also the last unit value of 34.60833 will not be applicable when Venus is in retrograde motion.

The avg. daily movement of Venus, when in regular direct motion is greater than the first unit. So, the first unit value of 1.15361 will work when Venus is in retrograde motion.

Note: The geocentric longitudinal value is taken from ZET with my setting and is for 09:30 AM Mumbai, India.

Right now, I am posting Nifty 50 charts. Later, will add more stocks.

Following images are self explanatory. The horizontal green and gray lines are for dates when Nifty made a low/high. The magenta colored lines are for the projected trend reversal dates.


Monday, February 8, 2016

Using Combustion of Planets for Trend Reversal


Somewhere, I came across a line in a Financial Astrology book or website, that trader should note the dates when Mercury combusts. As far as I know, very little information is available on this phenomenon, I mean with respect to trading.  So I thought let’s check this phenomenon and found some astonishing results, which I am sharing with you. This article will be of help to those who love to use astrology for trading. The combustion phenomenon can be used to find the trend reversal aka trend change time.

Now, what this Combustion means?

Combustion is a phenomenon which occurs when a planet comes very close to the Sun and loses its luster and shine due to this closeness and thus the planet is said to be combust. This phenomenon is called as Combustion.

So, combustion will occur when the planet conjuncts Sun.

As per Vedic Astrology, while in the state of combustion, the planets lack its strength. The degrees when the planets get combusted are mentioned below-

Moon                   12 Degrees
Mercury               14 Degrees (when retrograde 12 Degrees)
Venus                  10 Degrees (when retrograde 8 Degrees)
Mars                    17 Degrees
Jupiter                  11 Degrees
Saturn                  15 Degrees

These are to be considered both sides.

For ex: Mercury (at 100 degrees) conjuncts Sun, then Mercury will be in the state of combustion from 100-14=86 degrees to 114 degrees.

As we all know that, for a trader, the conjunction of Mercury and Sun are best and quite frequent (around 6-7 per calendar year). Another advantage with Mercury is that being a fast mover (when retrograde speed varies) all the phenomenon occurs fast.

If we see the combustion of Saturn and Sun, to come out of the combustion state, which is almost 30 degrees (equal to sign degrees), Saturn will take long, rather very long period. So all of you will now understand that the time taken to come out of this state will depend upon the speed and direction of motion (Direct or Retrograde) of the planet. Saturn, Jupiter, Mars, Venus, Mercury and then Moon… Got It…

I think it’s enough text on combustion. A picture is worth thousand words…

Those more interested on this phenomenon can Google it.

Now... Will this combustion help us in trading?

Yes. It will…

Then, How…?

See the self explanatory images below:


Even the Sun gives Trend Reversal, when it comes on the combustion starting and ending degrees!!!

All orange colored vertical lines denotes Sun at the combustion degrees.


Note: The geocentric longitudinal degrees used for this study are for 9:30 AM, Mumbai. This article considers only Combustion Phenomenon and NO other astrological relationships between the planets.

Tuesday, September 8, 2015

DLF - Heliocentric Longitude of Saturn with arbitrary constant numbers 0.528565 & 5.28565

I don’t remember how I found this “nuskha”, but it works…

Take any significant High/Low. Note down the HELIOCENTRIC degrees of Saturn on that day.

Add 0.528565 and 5.28565 to it.

Now check when Saturn comes very close to these values. Rather, the value should be crossed.

I have attached the image with 2 examples on it.

Let us take the first one, for explanation.

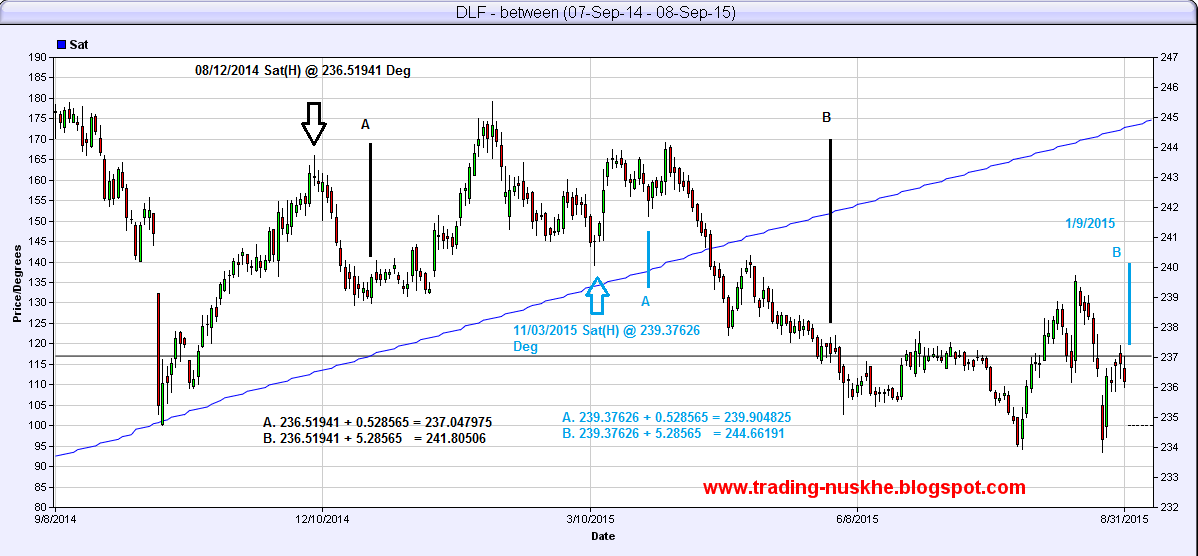
On 08/12/2014, DLF made a significant top (marked with a black arrow). Heliocentric Saturn was at 236.51941 degrees.

Adding 0.528565 to 236.51941 gives 237.047975.

Now, on 25/12/2014 Heliocentric Saturn was at 237.04255 degrees (time of these degrees is 9:30 AM). Saturn had not crossed the required degrees. These degrees were crossed on 26/12/2014 and was 237.07331. I have marked this date with black colored line “A”.

Now adding 5.28565 to 236.51941 gives 241.80506. Saturn crossed these degrees on 31/05/2015, marked with black colored lines “B”.

In the second example, DLF made low on 11/03/2015. Saturn was at 239.37626 degrees on this date (at 9:30 AM). Adding 0.528565 gives 239.904825, which was on 27/03/2015, marked with light blue colored line “A”.

Now adding 5.28565 to the degrees of Saturn of 11/03/2015 gives us 244.66191. Saturn crossed these degrees on 01/09/2015. This is marked with light blue colored line “B”.

As, I have not updated my software, I am attaching another image to show you what happened with DLF on 01/09/2015…. You can back test this “nuskha”. Sometimes the trend changes after 1 day.

If you have noted both the arbitrary constant numbers, you will see that the second is 10 times the first or first is one-tenth of the second. Actually I started with the second one i.e. 5.28565.

Note: I have taken the Heliocentric Longitude from ZET 9 Lite (free version)