Well, while studying the effect of Heliocentric Latitude of Venus on CNX Nifty (Nifty here after), I found this amazing "nuskha". And It works


Special Notes :
There will times when the answer you got, after doing the necessary maths, will go out of the minimum and maximum range of the latitude. The minimum heliocentric latitude is -3.39492 and the maximum is 3.39495. These are the extreme values. So, if the value goes beyond these level we have to either add/substract the extreme value from the original value.
Say we get -4.1230 as our answer after doing the maths. Then add the extreme value to it i.e.
-4.1230 + 3.39492
And if we get a positive answer, higher than the maximum value, we need to substract it from the answer i.e. the value obtained after doing the maths.
Say we get 4.1234 as our answer, then substract the maximum value from this.
If we forget the negation sign, the minimum and maximum values are not same. The difference is of 0.00003, which is negligible in our case. So when the answer goes beyond either of the values, you can simply add/substract 3.39492 or 3.39495.
Another important thing about this "nuskha" is that the horizontal lines drawn will somewhere, in future, intersect the Venus Latitude. These dates are also of importance. you can check in the images.
As mentioned in the title, this is Method - 1, using Heliocentric Latitude of Venus. I have found 2 more like this.
Before moving on to this "nuskha", I am assuming that everybody knows what latitude is. Those don’t know or are unable to remember, simply google it. Heliocentric Latitude when plotted will be like a sine wave. The values are positive and negative.
Now coming to the "nuskha".....
Take any significant High/Low as a starting point (say A), then take the immediate next Low/High (say B).
Next note down the Latitude of Venus on these 2 dates. These both values can be Negative or Positive or anyone be Positive and other Negative.
Then using simple mathematics, substract the second from the first i.e. A - B. Here you will have to go back to the school days to recall simple mathematics ;)
Because.....
A – (-B) = A + B [A minus (minus B) = A plus B]
-A – (-B) = -A + B [minus A minus (minus B) = minus A plus B] and so on...
These principles will be applicable for this "nuskha".
After getting the answer i.e. the value after substraction, you have to check when Venus will cross this value (in terms of Heliocentric Latitude) and that day will be your Trend Change Day or CIT or Turning Date.
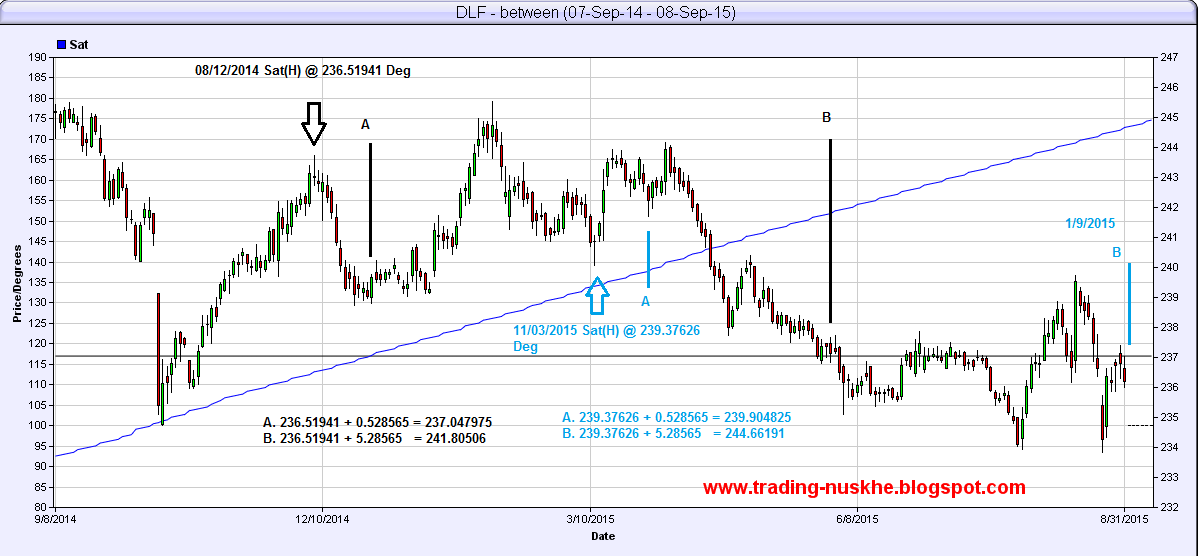
I have described this method with proper illustrations in the below images. I have used Nifty (3 images) and NTPC (1 image)
You will see 2 horizontal lines plotted. One is for the exact answer which could be either a positive or negative value. The other is for reverse value. Say you get a positive value, so one line is for it and other for its negative value.


Special Notes :
There will times when the answer you got, after doing the necessary maths, will go out of the minimum and maximum range of the latitude. The minimum heliocentric latitude is -3.39492 and the maximum is 3.39495. These are the extreme values. So, if the value goes beyond these level we have to either add/substract the extreme value from the original value.
Say we get -4.1230 as our answer after doing the maths. Then add the extreme value to it i.e.
-4.1230 + 3.39492
And if we get a positive answer, higher than the maximum value, we need to substract it from the answer i.e. the value obtained after doing the maths.
Say we get 4.1234 as our answer, then substract the maximum value from this.
If we forget the negation sign, the minimum and maximum values are not same. The difference is of 0.00003, which is negligible in our case. So when the answer goes beyond either of the values, you can simply add/substract 3.39492 or 3.39495.
Another important thing about this "nuskha" is that the horizontal lines drawn will somewhere, in future, intersect the Venus Latitude. These dates are also of importance. you can check in the images.
As mentioned in the title, this is Method - 1, using Heliocentric Latitude of Venus. I have found 2 more like this.
Note: I have taken the Heliocentric Latitude from ZET 9 Lite (free version). Here after, I will not mention this Note, unless the source of data is different.